

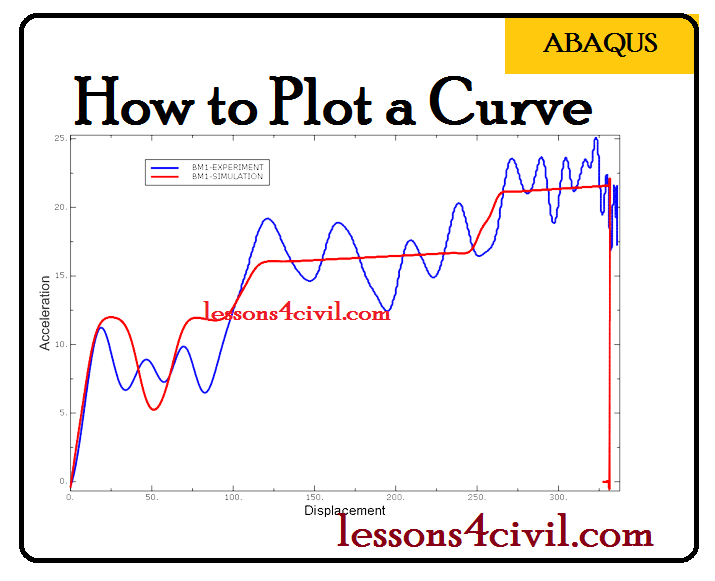
Plotting Curves in Abaqus?
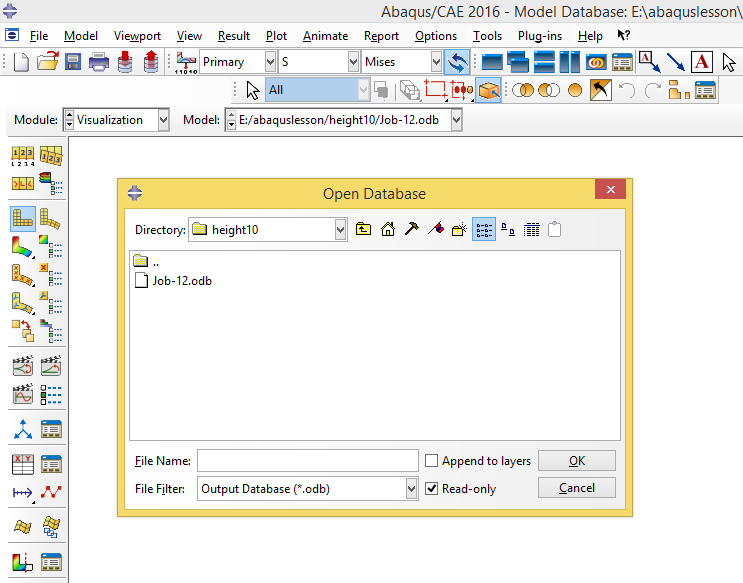
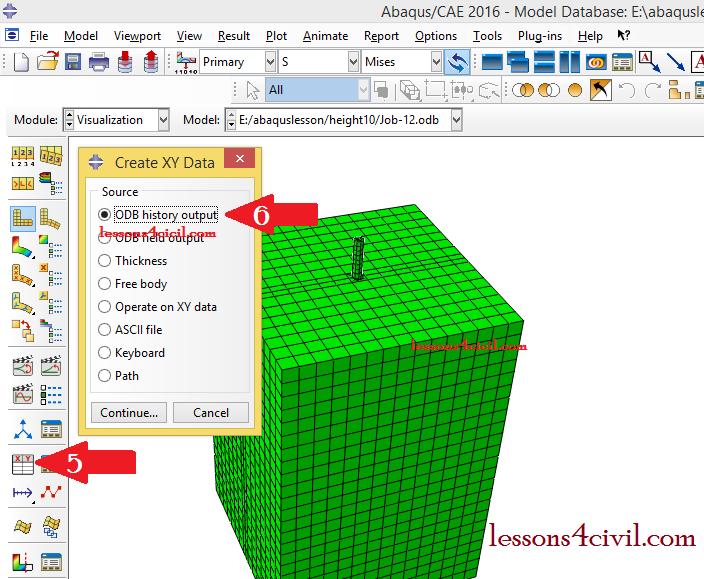
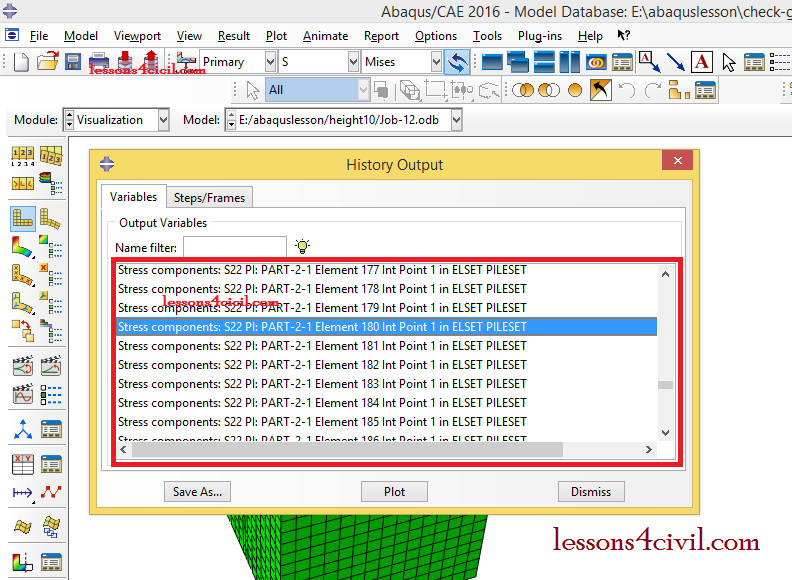
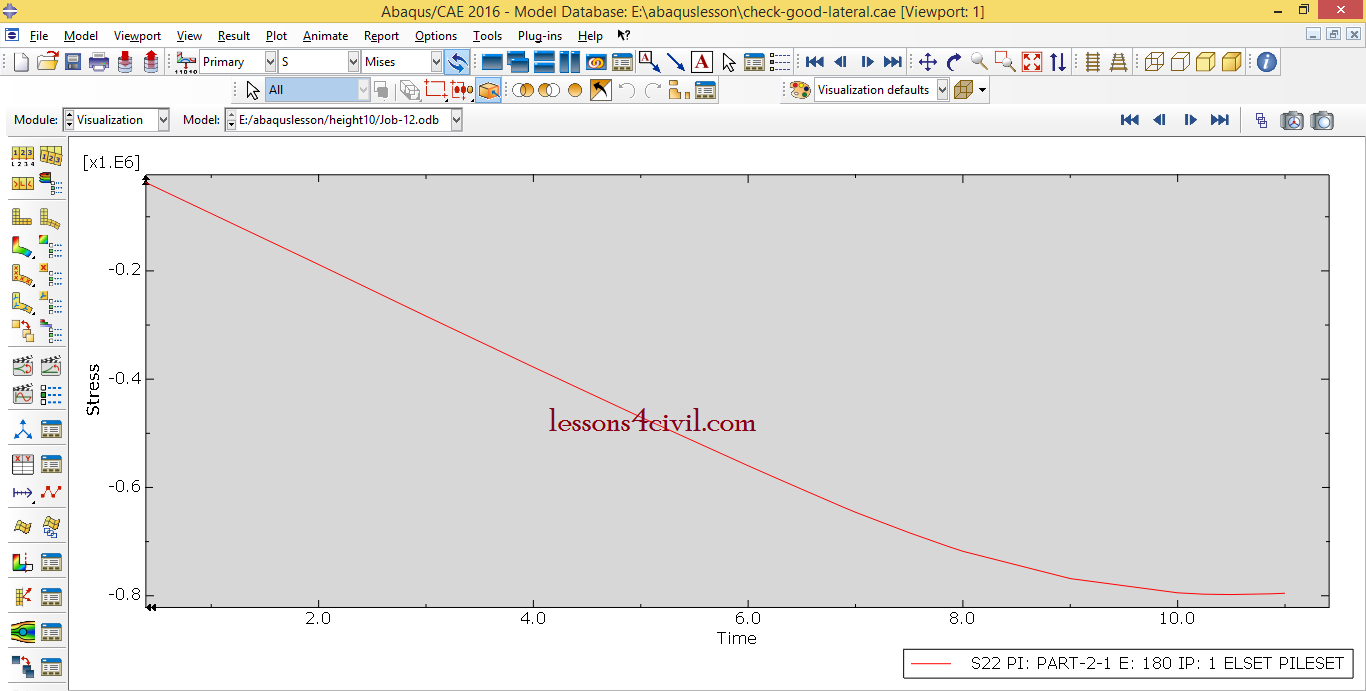
Plotting curves in ABAQUS is an easy job to do. Once the analysis is completed, to plot any curve related to the analysis, you need to go to visualization module. As it is illustrated in the figures, first open the “ODB ” file which contains the results of the analysis. Select its directory and click on ‘ok’. In the following window you can choose the “position” of the output variables (integration point in general but there are other possibilities). Next select the point (or element) for which you want to plot the curve. if you don’t know how to find out what the label of the node is click here and read another article.
Bear in mind opening the odb file might takes a while because it contains lots of information, so always choose only the necessary parameters for the field and history outputs.
Comments